

Debugging Tools
When a user sees an unexpected value, start with the tooling built into the Statsig console and SDKs. The sections below outline where to look and what each signal means.Diagnostics & Log Stream
Every gate, config, experiment, and layer has both a Setup and Diagnostics tab. The diagnostics view highlights pass/fail rates and bucketing counts so you can spot anomalies over time.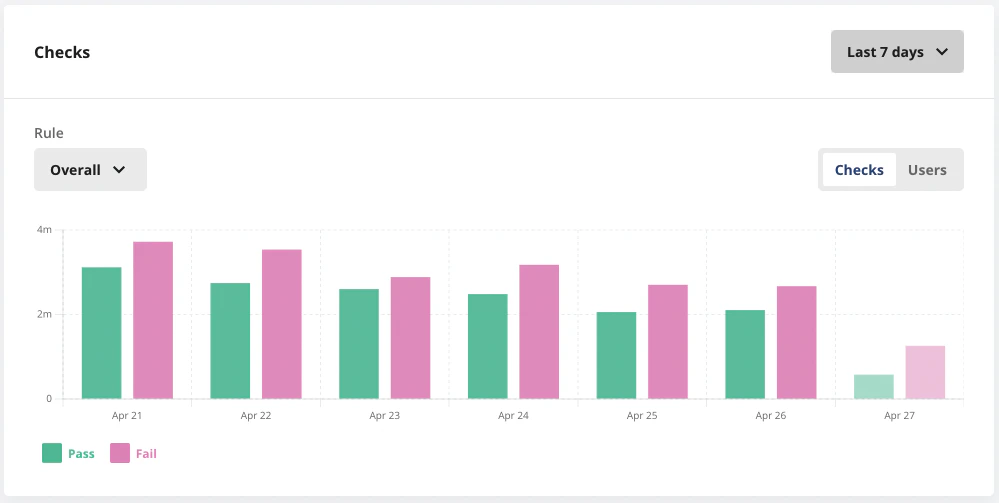
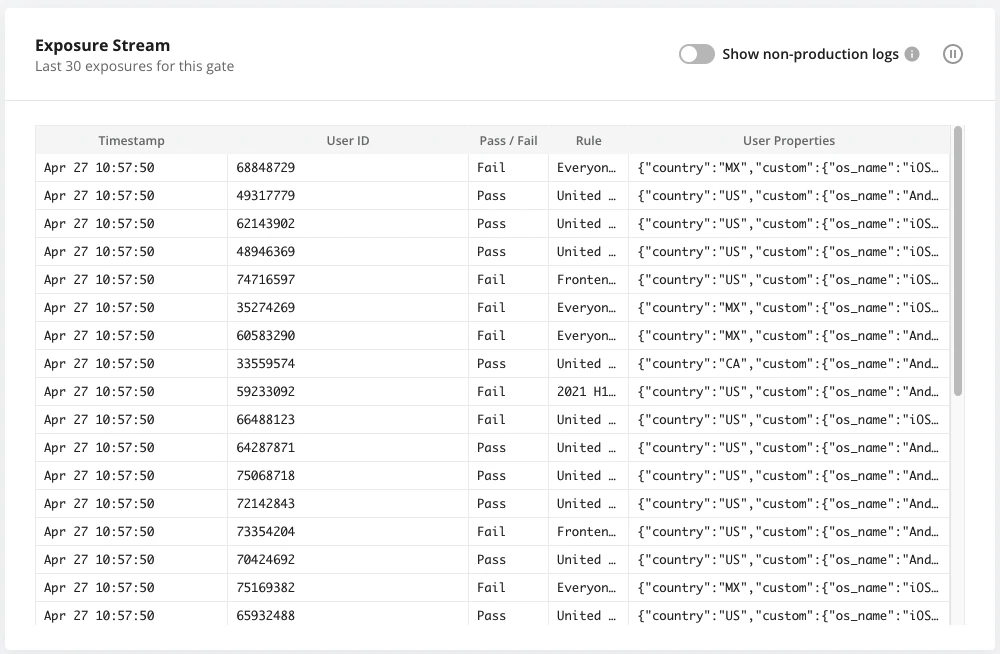
Enable Show non-production logs in the diagnostics view to surface checks coming from test keys and development builds.
Logging Levels and Expected Information
Statsig SDKs emit runtime logs across four verbosity levels:Debug– deep tracing meant for onboarding or issue triage.- Missing gate/config warnings when a definition is unavailable.
- Step-by-step messages that follow SDK initialization and evaluations.
Info– healthy lifecycle events for day-to-day operation.- Initialization summaries with source and SDK version details.
- Notifications when the configuration store is populated.
Warning– recoverable issues that might affect functionality.- Non-critical errors automatically handled by the SDK.
- gRPC reconnection attempts or similar transient network events.
Error– critical failures that block expected behavior.- Initialization timeouts or outright failures.
- Fallback notices that indicate gRPC is unavailable or misconfigured.
Evaluation Details
Click any exposure in the log stream to drill into the precise rule, user attributes, evaluation reason, SDK metadata, and server timestamps. That detail is often enough to pinpoint why a user received a specific value.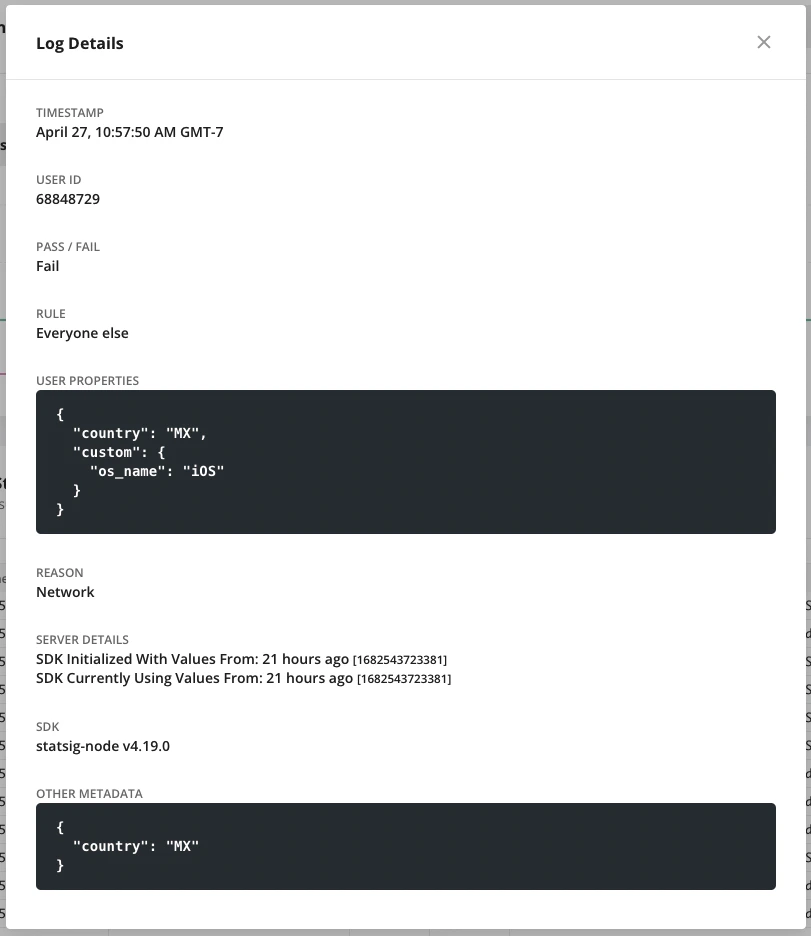
Evaluation Reasons
Evaluation reasons answer two questions: where the SDK sourced its definitions and why a particular value was returned. Use them to distinguish between healthy results, overrides, and error states.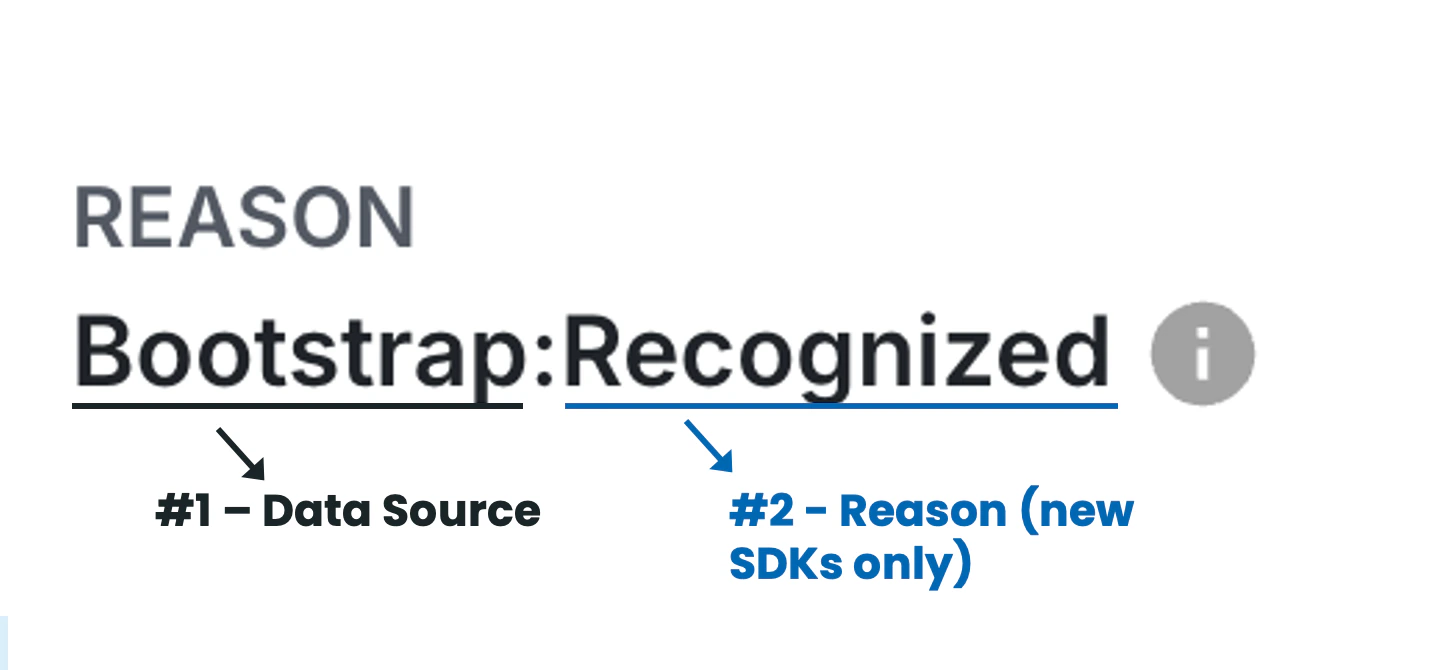
Evaluation Times
Evaluation timestamps reveal whether an SDK is serving fresh definitions. An up-to-date LCUT (Last Config Updated Time) indicates the SDK has the latest changes. If LCUT lags far behind, users may be seeing stale values—either because a browser tab stayed open or because a server integration is unable to sync.- Client SDKs
- Server SDKs
Mocking Statsig / Local Mode
Use the following tools to validate code paths without hitting the network:- Local mode: Set
localModetotrueso the SDK skips network calls and returns default values—ideal for tests and offline environments. - Override APIs: Call
overrideGateandoverrideConfigto force specific values for an individual user or globally.
Client SDK Debugger
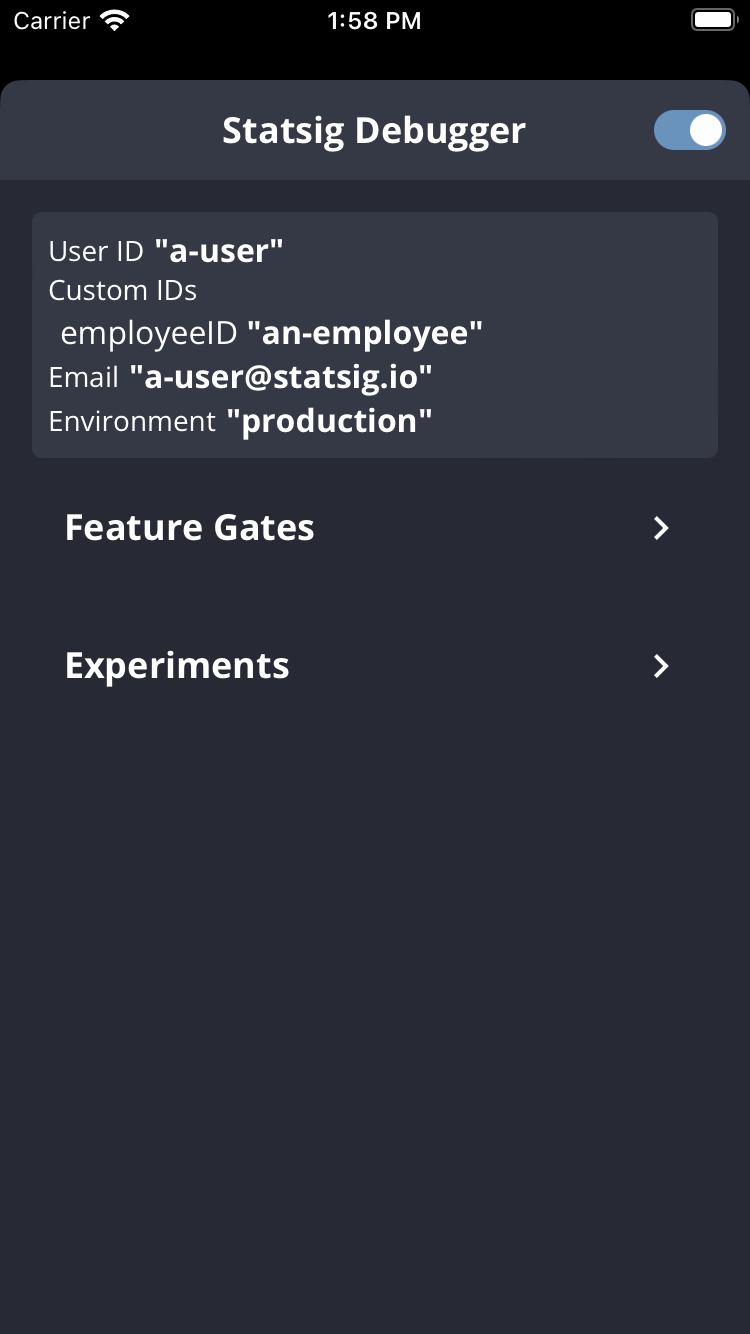
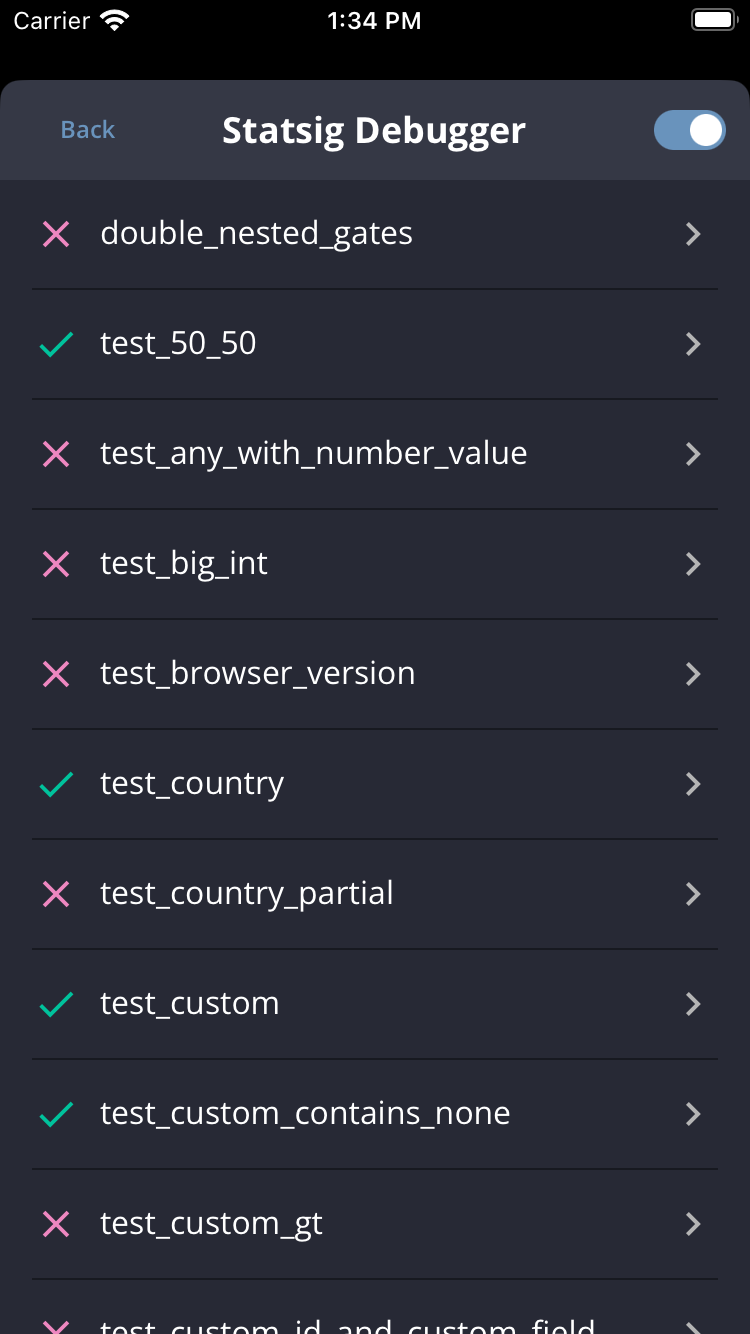
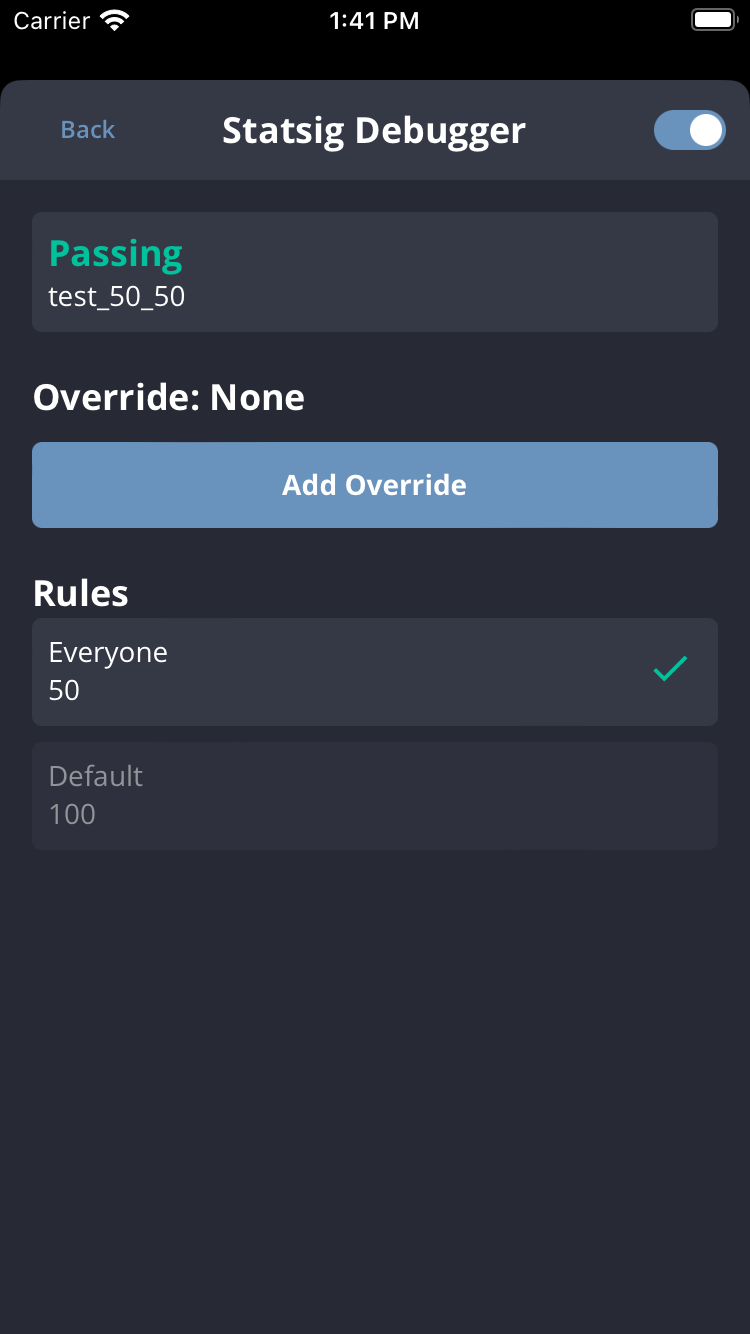
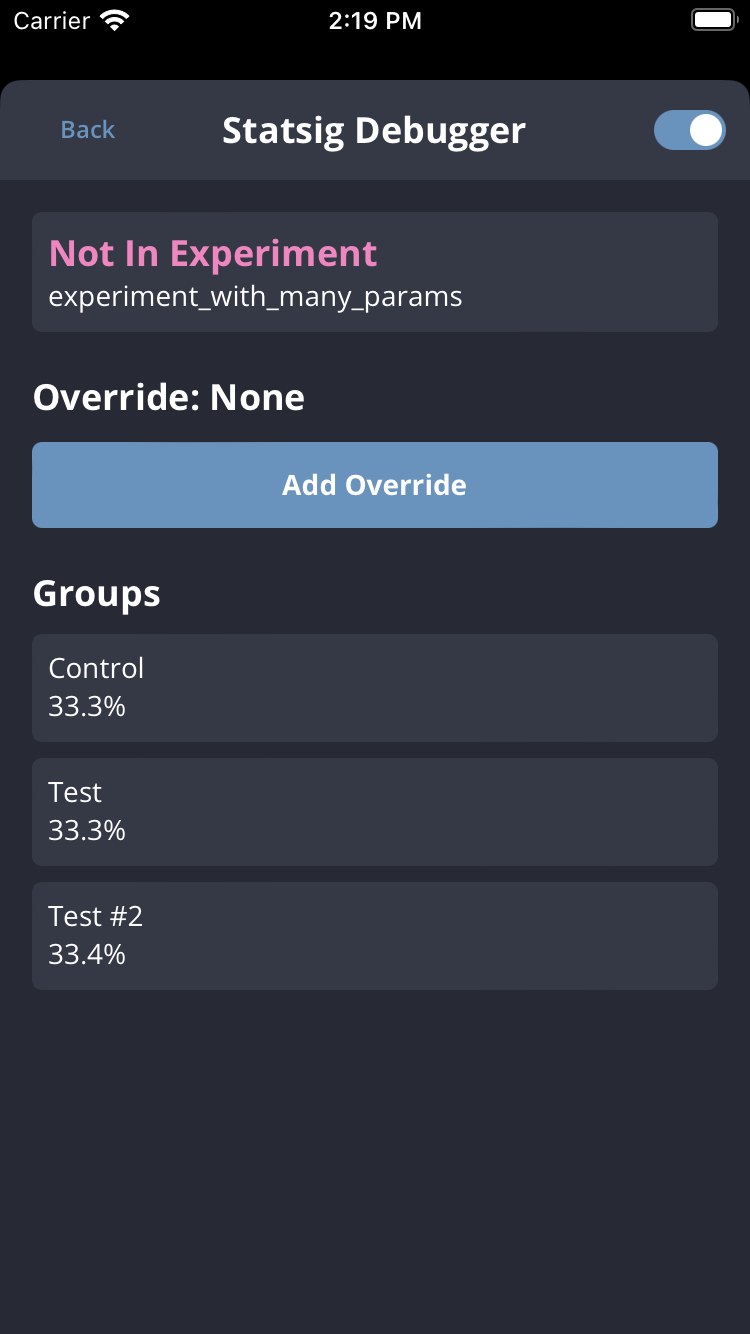
Inspect the exact values a client SDK is using by opening the Client SDK Debugger. It exposes the active user object and every gate/config tied to that client.- JavaScript / React: Use the Chrome extension.
- iOS: Call
Statsig.openDebugView()in v1.26.0 or later. - Android: Call
Statsig.openDebugView()in v4.29.0 or later.
Accounts that sign in to the Statsig console via Google SSO are currently unsupported by the Chrome extension.
| Landing | Gates List | Gate Details | Experiment Details |
|---|---|---|---|
 |  |  |  |
FAQs
For SDK-specific edge cases, check each SDK’s FAQ or contact us in the Statsig Slack community.Invalid Bootstrap
InvalidBootstrap occurs when a client SDK is bootstrapped with values generated for a different user profile. Always ensure the bootstrap user exactly matches the runtime user.
customIDs or other attributes results in a distinct user object.
BootstrapStableIDMismatch
BootstrapStableIDMismatch is similar but focuses on stableID. Client SDKs generate a stable ID automatically when one is not provided, so mixing empty user objects between server and client code can cause drift.
{}, the client-generated stable ID may not match the server’s, leading to the same warning.
Environments
SDKs inherit their environment from initialization options. If none is provided, the SDK defaults to production. To verify which environment a user evaluated under, open the diagnostics log stream and inspect thestatsigEnvironment property attached to the exposure.
Maximizing Event Throughput
Python SDK v0.45.0+ introduces tunables that help handle high event volume without drops.
eventQueueSize– Number of events flushed per batch. Larger batches increase throughput but use more memory; keep the value under ~3000 to avoid oversized payloads.retryQueueSize– Number of batches kept for retrying. The default is 10; raise it to retain more data at the cost of memory.